import numpy as np

masses_mg = np.array([12.4, 9.8, 15.1])
masses_mg, masses_mg.dtype, masses_mg.shape
(array([12.4, 9.8, 15.1]), dtype('float64'), (3,))dtype and shape, and index and slice them in one and two dimensions.& and |.axis=0 or axis=1.np.random.default_rng(42) and solve a small linear system with np.linalg.solve.X of shape (n_samples, n_features) and a target vector y.A plate reader has just handed you a grid of absorbance readings: 96 wells, each measured every two minutes for an hour. That is about 3,000 numbers, and the questions you want to ask are all whole-grid questions. Which well reacted fastest? What is the mean of the blanks at each time point? Subtract the blank from everything. With lists you would write a loop for each question. With a NumPy arrayNumPy arrayA fixed-type, n-dimensional grid of numbers that supports fast whole-array arithmetic. each one is a line, and it runs in compiled code. NumPy is the layer underneath pandas, matplotlib and scikit-learn, so the ideas here, shapes, axes, masks and broadcasting, come back in every later episode.
Build an array from a list with np.array. Two attributes tell you what you have: the dtypedtypeThe data type shared by every element of an array, such as float64 or int64., the single data type shared by every element, and the shapeshapeThe size of an array along each axis, e.g. (n_samples, n_features)., the size along each dimension.
import numpy as np
masses_mg = np.array([12.4, 9.8, 15.1])
masses_mg, masses_mg.dtype, masses_mg.shape(array([12.4, 9.8, 15.1]), dtype('float64'), (3,))Three floats, 64-bit, in a one-dimensional array of length 3. The shape is a tuple even in one dimension, hence (3,). Unlike a list, an array holds one type only: mix an integer and a float and NumPy promotes everything to float; mix a string in and everything becomes text, which is rarely what you wanted.
The pay-off is arithmetic that applies to the whole array at once:
molar_mass = 18.015
volume_L = 0.250

masses_mg / molar_mass / volume_L      # mmol/L, for every sample
array([2.75326117, 2.17596447, 3.35276159])No loop. The expression reads like the formula on the page, and the result is a new array of the same shape. This is the pattern from episode 1.1’s comprehension, generalised to any arithmetic and running far faster.
Two-dimensional arrays come from nested lists. Here is a small piece of that plate: four wells, five time points, absorbance at 405 nm.
plate = np.array([
    [0.052, 0.131, 0.209, 0.288, 0.365],   # well A1
    [0.049, 0.102, 0.158, 0.211, 0.263],   # well A2
    [0.055, 0.058, 0.061, 0.063, 0.066],   # well A3, no enzyme
    [0.050, 0.149, 0.247, 0.348, 0.447],   # well A4
])
plate.shape, plate.ndim
((4, 5), 2)This is how every plate-reader export looks once loaded: one row per well, one column per time point (or per wavelength, or per replicate). Keeping the data as a 2-D array rather than 96 separate lists means “the blank at each time point” is plate[2], “every well at t = 0” is plate[:, 0], and “subtract the blank from every well” is one subtraction. A 384-well plate is the same code with a different shape.
Indexing follows episode 1.1: positions start at 0, slices are half-open. In two dimensions you give a row index and a column index, separated by a comma.
plate[0, 4] # well A1, last time pointnp.float64(0.365)A bare colon means “everything along this axis”, which is how you take a whole row or column:
plate[2], plate[:, 0](array([0.055, 0.058, 0.061, 0.063, 0.066]),
array([0.052, 0.049, 0.055, 0.05 ]))plate[2] is the third row (the blank), a 1-D array of five readings. plate[:, 0] is the first column, a 1-D array of four readings at \(t = 0\). Slices combine freely: plate[:2, 1:3] is the top two wells at time points 1 and 2, a 2×2 block.
Slices are views, not copies
first_two = plate[:2] does not copy the data. Writing first_two[0, 0] = 0 changes plate too. This is deliberate (copying a million-element array for every slice would be wasteful), but it surprises everyone once. Use plate[:2].copy() when you intend to modify the piece independently.
Comparing an array with a number gives an array of True/False of the same shape, a boolean maskboolean maskAn array of True/False values used to select the elements where it is True.. Indexing with a mask keeps the elements where it is True.
final = plate[:, -1]                 # absorbance at the last time point
reacted = final > 0.1
final, reacted, final[reacted]
(array([0.365, 0.263, 0.066, 0.447]),
array([ True, True, False, True]),
array([0.365, 0.263, 0.447]))Three of the four wells rose above 0.1; the blank did not. Because True counts as 1, reacted.sum() is the number of wells that reacted and reacted.mean() is the fraction. To combine conditions use & (and), | (or) and ~ (not), each condition in its own parentheses:
(final > 0.1) & (final < 0.4)array([ True, True, False, False])and is not &
(final > 0.1) and (final < 0.4) raises ValueError: The truth value of an array with more than one element is ambiguous. Python’s and wants a single True or False; an array of them is neither. Use & and |, and keep the parentheses: & binds tighter than >, so final > 0.1 & final < 0.4 is parsed as final > (0.1 & final) < 0.4, which is nonsense.
Here is the experiment that justifies NumPy. Take a million absorbance readings, convert each to a concentration with the Beer–Lambert law, \(c = A / (\varepsilon \ell)\), once with a Python loop and once as an array expression, and time both with time.perf_counter().
Before you run the cell: how many times faster do you expect the array version to be? Two times? Ten? A thousand? Write your guess down.
import time

rng = np.random.default_rng(42)
absorbance = rng.uniform(0.05, 1.5, size=1_000_000)
epsilon, path_cm = 6220.0, 1.0            # NADH at 340 nm, L/(mol cm)

t0 = time.perf_counter()
conc_loop = [a / (epsilon * path_cm) for a in absorbance]
t1 = time.perf_counter()
conc_array = absorbance / (epsilon * path_cm)
t2 = time.perf_counter()

print(f"loop:  {t1 - t0:.3f} s    array: {t2 - t1:.4f} s    "
      f"speed-up: about {(t1 - t0) / (t2 - t1):.0f}x")
loop: 0.588 s array: 0.0604 s speed-up: about 10xThe exact number depends on your machine (and on whatever else it is doing), but the array version is reliably tens to hundreds of times faster. This is vectorisationvectorisationReplacing Python loops with whole-array operations that NumPy runs in compiled code.: instead of Python visiting each element, checking its type and performing one operation, NumPy hands the whole block of 64-bit floats to a compiled loop. The code is also shorter and says what you compute rather than how to iterate, which is why the rest of this course almost never loops over data.
The rule of thumb: if you are writing for over the elements of an array, stop and look for the array expression. Comparisons, arithmetic, np.log10, np.exp, np.sqrt and friends all apply element-wise.
Arithmetic between two arrays of the same shape is element-wise. Arithmetic between arrays of different shapes works when NumPy can stretch one to match the other, a rule called broadcastingbroadcastingNumPy’s rules for combining arrays of different shapes, such as subtracting a row vector from every row.. The most useful case is subtracting one row from every row of a matrix.
Take the descriptors of four molecules, three featuresfeatureAn input variable describing a sample; one column of the X matrix. each: molecular weight in g/mol, number of rings, and polar surface area in Ų. Column means come from axis=0:
X = np.array([
    [180.2, 1, 90.2],     # glucose
    [ 78.1, 1,  0.0],     # benzene
    [ 46.1, 0, 20.2],     # ethanol
    [194.2, 2, 61.8],     # caffeine
])
means = X.mean(axis=0)
means
array([124.65, 1. , 43.05])X has shape (4, 3) and means has shape (3,). Subtracting them centres every column at zero:
X_centred = X - means
X_centred.round(1)
array([[ 55.6, 0. , 47.2],
[-46.6, 0. , -43. ],
[-78.5, -1. , -22.8],
[ 69.6, 1. , 18.8]])In words, NumPy lines the shapes up from the right: (4, 3) against (3,). The trailing dimensions match (3 and 3). The leading dimension is missing from means, so NumPy treats it as 1 and stretches it to 4, as if means were copied into four identical rows. No copy is actually made; the arithmetic simply reuses the same row. The same rule explains the simplest case of all, X * 2: a scalar has no dimensions, so it is stretched to every element.
Two shapes are compatible when, reading from the right, every pair of dimensions is either equal or one of them is 1. (4, 3) with (3,) works. (4, 3) with (4,) does not: 3 against 4, neither is 1. To subtract a per-row value, such as each well’s reading at \(t = 0\), you need the row values as a column of shape (4, 1):
baseline = plate[:, [0]]           # shape (4, 1), not (4,)
(plate - baseline).round(3)
array([[0. , 0.079, 0.157, 0.236, 0.313],
[0. , 0.053, 0.109, 0.162, 0.214],
[0. , 0.003, 0.006, 0.008, 0.011],
[0. , 0.099, 0.197, 0.298, 0.397]])Indexing with a list [0] instead of the integer 0 keeps the dimension, which is exactly what broadcasting needs. plate[:, 0:1] and plate[:, 0][:, np.newaxis] do the same thing.
A 1-D array is a vector in \(\mathbb{R}^n\), a 2-D array is a matrix in \(\mathbb{R}^{m \times n}\), and element-wise operations are the Hadamard operations. Broadcasting a row vector \(\mathbf{m}^\top\) across a matrix \(X\) computes \(X - \mathbf{1}\mathbf{m}^\top\), the outer product of the all-ones column with the row, without forming it. The same mechanism gives outer operations for free: for column vector \(\mathbf{a}\) of shape \((n, 1)\) and row vector \(\mathbf{b}\) of shape \((1, k)\), a * b is the outer product \(\mathbf{a}\mathbf{b}^\top\) and a - b is the matrix of all pairwise differences, the first step of every distance computation in Part II. The matrix product is a different operation, written @, below.
sum, mean, std, min, max, argmax and their relatives all take an axis argument. The axisaxisA dimension of an array; axis 0 runs down the rows, axis 1 across the columns. is the dimension that disappears: axis=0 runs down the rows and leaves one number per column; axis=1 runs across the columns and leaves one number per row. With no axis the whole array collapses to one number.
print("per time point (axis=0):", plate.mean(axis=0).round(3))
print("per well       (axis=1):", plate.mean(axis=1).round(3))
print("overall                :", plate.mean().round(3))
per time point (axis=0): [0.052 0.11 0.169 0.228 0.285]
per well (axis=1): [0.209 0.157 0.061 0.248]
overall : 0.169The first line averages the four wells at each time point (five numbers); the second averages the five readings of each well (four numbers). A quick way to remember: the result’s shape is the input shape with the named axis removed, so (4, 5) with axis=0 gives (5,).
rates = (plate[:, -1] - plate[:, 0]) / 8.0      # absorbance per minute over 8 min
fastest = rates.argmax()
print(f"rates: {rates.round(4)}   fastest well: row {fastest}")
rates: [0.0391 0.0268 0.0014 0.0496] fastest well: row 3argmax returns the position of the maximum, which is how you get from “which value is largest” to “which well”.
Standard deviation: NumPy divides by n
np.std computes the population standard deviation (dividing by \(n\)). pandas and most statistics packages divide by \(n - 1\) (the sample standard deviation). On three replicates the difference is large. If you want the sample version from NumPy, pass ddof=1.
Simulations, bootstrapping, shuffling data before a split: all need random numbers, and all must give the same answer tomorrow. NumPy’s random number generatorrandom number generatorAn object that produces reproducible pseudo-random numbers; create it once with np.random.default_rng(seed). is an object you create once with a seed and then draw from:
rng = np.random.default_rng(42)

print("normal  :", rng.normal(loc=100, scale=5, size=4).round(1))   # mean 100, sd 5
print("uniform :", rng.uniform(0, 1, size=3).round(3))
print("integers:", rng.integers(1, 7, size=6))                       # dice: 1..6, upper bound excluded
print("choice  :", rng.choice(["Adelie", "Chinstrap", "Gentoo"], size=4))
normal : [101.5 94.8 103.8 104.7]
uniform : [0.094 0.976 0.761]
integers: [5 5 4 1 6 3]
choice : ['Chinstrap' 'Chinstrap' 'Adelie' 'Gentoo']The seed, 42 by convention, fixes the entire sequence. Re-create the generator with the same seed and you get the same numbers in the same order; so does your colleague, and so does this website when it is rebuilt. That is what makes “I shuffled the data and got RMSE 0.93” a statement someone else can check. Draw everything from the one generator rather than creating a new one per cell, and avoid the older global-state functions (np.random.rand and the module-level seed) that you will see in old tutorials: any cell or library can reset that shared state behind your back.
A thousand replicate measurements of a 100 µM standard, with 5% instrument noise, look like this:
import matplotlib.pyplot as plt

measurements = rng.normal(loc=100, scale=5, size=1000)

fig, ax = plt.subplots()
ax.hist(measurements, bins=30)
ax.set(xlabel="measured concentration (µM)", ylabel="count",
       title="1000 draws from normal(100, 5)")
plt.show()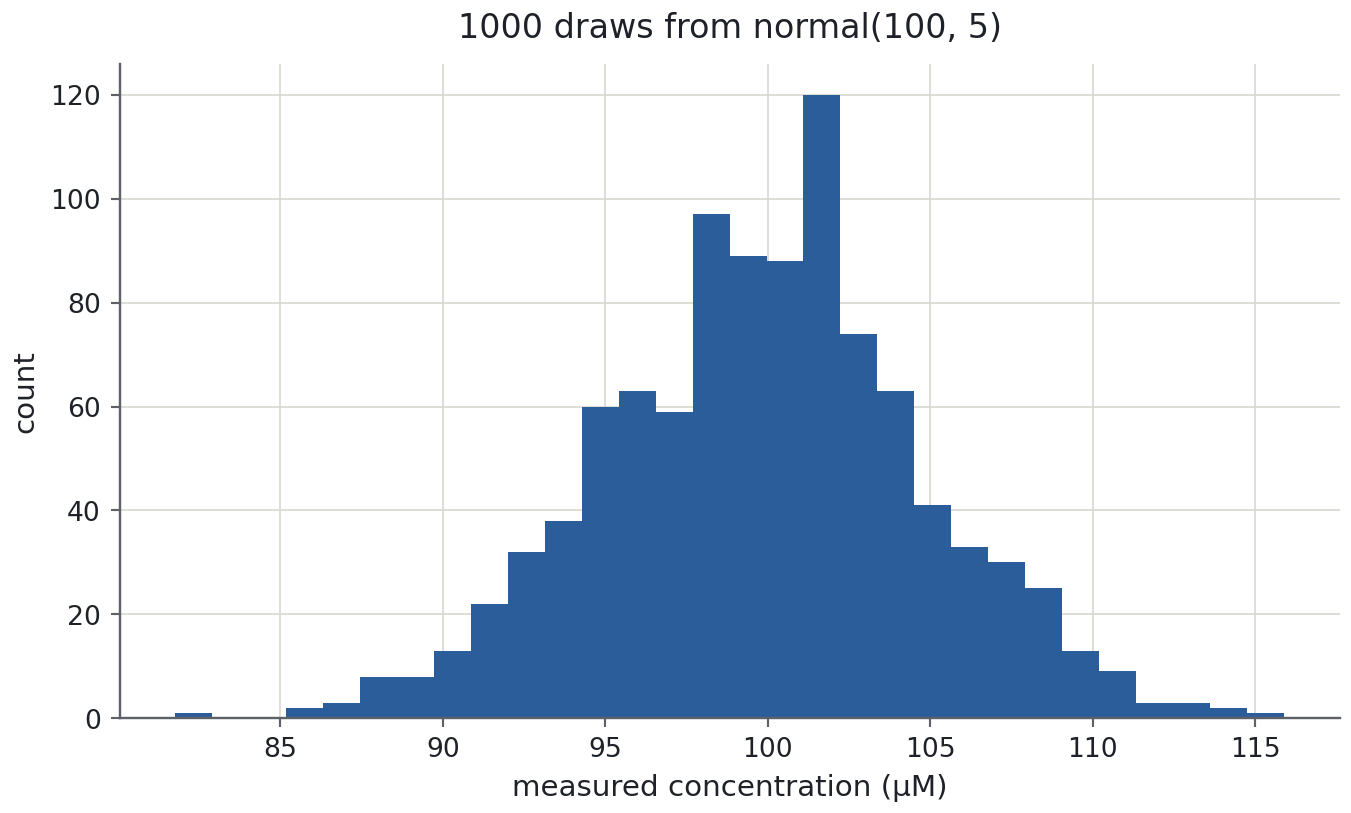
The histogram is the bell curve you expect, centred on 100 with almost everything within 15 µM (three standard deviations). Episode 1.4 covers the plotting commands; for now notice the shape of the code: fig, ax = plt.subplots(), draw on ax, label with units, plt.show().
@ and solving a linear system* multiplies element by element. The matrix product is @. You need it rarely in this chapter and constantly from Chapter 2 on, so here is one concrete use: mixing stock solutions.
You have two stock solutions. Stock 1 is 50 mM Tris and 10 mM NaCl; stock 2 is 10 mM Tris and 100 mM NaCl. You want one litre of buffer containing 20 mmol Tris and 40 mmol NaCl, topped up with water. Which volumes \(v_1\) and \(v_2\) (in litres) of each stock do you need? Each solute gives one equation:
\[ 50\,v_1 + 10\,v_2 = 20, \qquad 10\,v_1 + 100\,v_2 = 40 . \]
In matrix form that is \(A\mathbf{v} = \mathbf{b}\), with \(A\) holding the stock concentrations (one row per solute, one column per stock) and \(\mathbf{b}\) the target amounts:
A = np.array([[50.0, 10.0],
              [10.0, 100.0]])
b = np.array([20.0, 40.0])

v = np.linalg.solve(A, b)
print(f"stock 1: {v[0]:.3f} L   stock 2: {v[1]:.3f} L   water: {1 - v.sum():.3f} L")
print("check A @ v =", A @ v)
stock 1: 0.327 L stock 2: 0.367 L water: 0.306 L
check A @ v = [20. 40.]About 327 mL of stock 1, 367 mL of stock 2 and water to a litre. A @ v reproduces the target amounts, which is the test that you solved the right system. With ten solutes and ten stocks the code is identical; only the shapes change. Never invert a matrix to solve a system (np.linalg.inv(A) @ b): solve is faster and numerically safer, and in Chapter 2 the same function fits a linear regression through the normal equationnormal equationThe linear system XᵀXθ = Xᵀy whose solutions minimise the squared error of a linear model..
X is (n_samples, n_features); y is (n_samples,)
Every dataset in this course, and every scikit-learn estimator, uses one layout, the X / y conventionX / y conventionFeatures in a 2-D array X of shape (n_samples, n_features); targets in a 1-D array y.:
X is a 2-D array with one row per sample (a molecule, a penguin, a patient) and one column per feature (a descriptor, a measurement). Its shape is (n_samples, n_features).y is a 1-D array with one target per sample, the labellabelThe quantity you want to predict for each sample; the vector y. you want to predict. Its shape is (n_samples,), and its length equals the number of rows of X.The four-molecule descriptor matrix above is already an X. Add the quantity you want to predict, say measured solubility as logS in log₁₀(mol/L), and you have a complete supervised-learning dataset:
y = np.array([0.74, -1.64, 1.10, -0.88])   # logS: glucose, benzene, ethanol, caffeine

print("X:", X.shape, "  y:", y.shape)
print("features of molecule 3 (caffeine):", X[3])
print("all molecular weights:            ", X[:, 0])
X: (4, 3) y: (4,)
features of molecule 3 (caffeine): [194.2 2. 61.8]
all molecular weights: [180.2 78.1 46.1 194.2]X[i] is one sample, X[:, j] is one feature across all samples, and X.mean(axis=0) is the vector of feature means. Keep this picture: it is what axis=0 means for the rest of the course.
Shapes and axes
Without running code, write down the shape of each result: plate[1], plate[:, 1], plate[1:3, :2], plate.sum(axis=0), plate.sum(axis=1), plate > 0.1. Then check your answers.
for name, value in [
    ("plate[1]", plate[1]),
    ("plate[:, 1]", plate[:, 1]),
    ("plate[1:3, :2]", plate[1:3, :2]),
    ("plate.sum(axis=0)", plate.sum(axis=0)),
    ("plate.sum(axis=1)", plate.sum(axis=1)),
    ("plate > 0.1", plate > 0.1),
]:
    print(f"{name:<20}{str(value.shape):>8}   dtype {value.dtype}")
plate[1] (5,) dtype float64
plate[:, 1] (4,) dtype float64
plate[1:3, :2] (2, 2) dtype float64
plate.sum(axis=0) (5,) dtype float64
plate.sum(axis=1) (4,) dtype float64
plate > 0.1 (4, 5) dtype boolA single integer index removes that axis ((4, 5) becomes (5,) for a row, (4,) for a column); a slice keeps it, so plate[1:3, :2] stays 2-D. Aggregating along an axis removes it: axis=0 leaves one number per column, (5,); axis=1 one per row, (4,). A comparison keeps the shape and changes the dtype to bool.
Debug this
A colleague wants the mean of the readings that fall between 90 and 110 µM. Neither attempt works. Find the bug in each, then write a version that does.
readings = rng.normal(loc=100, scale=5, size=1000)

# attempt 1
good = []
for r in readings:
    if r > 90 and r < 110:
        good.append(r)
print(good.mean())

# attempt 2
good = readings[readings > 90 and readings < 110]
print(good.mean())Attempt 1 builds a Python list, and lists have no .mean() method, so the last line raises AttributeError: 'list' object has no attribute 'mean'. The loop itself is fine (comparing one float with and is legal), just slow. np.mean(good) would rescue it, but the better fix is to drop the loop.
Attempt 2 uses and on two arrays, which raises ValueError: The truth value of an array with more than one element is ambiguous. Element-wise “and” is &, and each comparison needs parentheses.
readings = rng.normal(loc=100, scale=5, size=1000)

mask = (readings > 90) & (readings < 110)
print(f"{mask.sum()} readings kept, mean {readings[mask].mean():.2f} µM")
946 readings kept, mean 99.74 µMAbout 95% of draws fall within two standard deviations of the mean, so roughly 950 readings are kept, and their mean is close to 100 because the window is symmetric.
Normalise the plate
For each well in plate, subtract its own reading at \(t = 0\) (use broadcasting with a (4, 1) column, not a loop), then divide every well by the final reading of the fastest well so that the largest value on the plate is 1. Report the shape at each step and the normalised final readings.
zeroed = plate - plate[:, [0]]                    # (4, 5) - (4, 1)
fastest = zeroed[:, -1].argmax()
normalised = zeroed / zeroed[fastest, -1]         # (4, 5) / scalar

print("zeroed:", zeroed.shape, " normalised:", normalised.shape)
print("final readings, normalised:", normalised[:, -1].round(3))
zeroed: (4, 5) normalised: (4, 5)
final readings, normalised: [0.788 0.539 0.028 1. ]plate[:, [0]] keeps the column dimension, so its shape (4, 1) broadcasts against (4, 5) by stretching along the time axis: every reading in a row has that row’s \(t = 0\) value subtracted. Had you written plate[:, 0] (shape (4,)) NumPy would have tried to line 4 up against 5 and failed. Dividing by a scalar broadcasts to every element. Well A4 (row 3) is the fastest and lands exactly at 1; the blank stays near 0.
A calibration line by linear algebra
A Beer–Lambert calibration measured absorbance at five known concentrations. Fit the straight line \(A = \theta_0 + \theta_1 c\) by solving the normal equations \((X^\top X)\,\boldsymbol{\theta} = X^\top \mathbf{y}\) with np.linalg.solve, where X has a column of ones (for the intercept) and a column of concentrations. Compare with np.linalg.lstsq(X, y, rcond=None)[0], and use the fitted line to estimate the concentration of a sample with absorbance 0.40.
conc = np.array([0.0, 0.1, 0.2, 0.4, 0.8])          # mM
absorb = np.array([0.023, 0.135, 0.278, 0.529, 1.000])conc = np.array([0.0, 0.1, 0.2, 0.4, 0.8])
absorb = np.array([0.023, 0.135, 0.278, 0.529, 1.000])
X_cal = np.column_stack([np.ones(len(conc)), conc]) # shape (5, 2)
theta = np.linalg.solve(X_cal.T @ X_cal, X_cal.T @ absorb)
theta_lstsq = np.linalg.lstsq(X_cal, absorb, rcond=None)[0]
print("normal equations:", theta.round(4))
print("lstsq :", theta_lstsq.round(4))
print(f"sample at A = 0.40: {(0.40 - theta[0]) / theta[1]:.3f} mM")normal equations: [0.0246 1.228 ]
lstsq : [0.0246 1.228 ]
sample at A = 0.40: 0.306 mMX_cal is an X in the sense of this episode: five samples, two features (a constant and the concentration), and absorb is the y. X.T @ X is 2×2 and X.T @ y has two entries, so solve returns the intercept and the slope that minimise the squared vertical distances to the line. lstsq gives the same answer by a numerically more careful route and is what you should use in practice; the point of doing it by hand once is that episode 2.2 fits linear regression with exactly this equation, and LinearRegression().fit(X, y) is this cell wrapped in a class.
The feature matrix X and target y you built here are the input to every model in the course: in Chapter 2 train_test_split(X, y) carves them into training and test sets and LinearRegression().fit(X, y) solves the same normal equations as the last exercise, at scale. Broadcasting is how feature scaling works ((X - X.mean(axis=0)) / X.std(axis=0)), how distances between molecules are computed in Part II, and how a whole gene-expression matrix is normalised in Part III. The next episode, 1.3, puts labels on the rows and columns of an array and calls the result a DataFrame.